Of course! "Python bioinformatics" is a powerful and popular combination. Python is the go-to language for bioinformatics due to its excellent libraries, readability, and strong community support.

Let's break down what this means, from the basics to advanced applications.
Why Python for Bioinformatics?
Python is the ideal choice for several key reasons:
- Rich Ecosystem of Libraries: This is the most important factor. There's a Python library for almost every task in bioinformatics.
- Readable and Simple Syntax: Biology data is complex; the last thing you need is complex code. Python's clean syntax makes it easier to write and understand scripts for data analysis.
- Versatility: You can use Python for everything from simple data manipulation to building complex machine learning models and web applications.
- Strong Community: If you have a problem, chances are someone else has already solved it. The community is large, active, and very helpful on platforms like Stack Overflow and GitHub.
- Interoperability: Python can easily call other programs and languages (like R or C++) and be used as a "glue" language to connect different bioinformatics tools.
Core Python Libraries in Bioinformatics
Here are the essential libraries you'll need to know, categorized by their function.
Sequence Manipulation & Analysis
-
Biopython: The absolute cornerstone of bioinformatics in Python. If you learn only one library, make it this one.
 (图片来源网络,侵删)
- Seq Object: Represents a biological sequence (DNA, RNA, Protein) with its alphabet.
- SeqIO: For reading and writing sequence files in various formats (FASTA, GenBank, FASTQ, etc.).
- AlignIO: For reading and writing multiple sequence alignments.
- NCBI BLAST: Interact with the NCBI BLAST service directly from your script.
- Entrez: Access the NCBI's Entrez databases (like PubMed) to fetch data.
Example (Reading a FASTA file with Biopython):
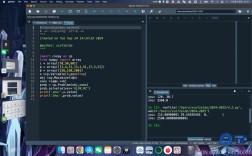
from Bio import SeqIO # Read a FASTA file for record in SeqIO.parse("my_sequences.fasta", "fasta"): print(f"ID: {record.id}") print(f"Description: {record.description}") print(f"Sequence Length: {len(record)}") print(f"Sequence: {record.seq}\n") -
PyVCF: A library for parsing Variant Call Format (VCF) files, which are standard for storing genetic variation data (like SNPs).
Data Manipulation & Numerical Computing
-
NumPy: The fundamental package for numerical computation in Python. It provides powerful N-dimensional array objects and functions for operating on them. Essential for handling numerical data from gene expression arrays or sequencing quality scores.
- Use Case: Storing and performing math on a matrix of gene expression values.
-
Pandas: Built on top of NumPy, Pandas is the go-to library for data manipulation and analysis. Its
DataFrameobject is perfect for handling tabular biological data (like from a CSV or TSV file). (图片来源网络,侵删)
- Use Case: Loading a table of sample metadata, filtering samples, and calculating summary statistics.
Example (Filtering a DataFrame with Pandas):
import pandas as pd
# Load a CSV file of sample metadata
metadata = pd.read_csv("sample_metadata.csv")
# Filter for samples from a specific tissue type
brain_samples = metadata[metadata['tissue'] == 'brain']
print(brain_samples.head())
Data Visualization
-
Matplotlib: The foundational plotting library in Python. It's highly customizable but can be verbose.
-
Seaborn: A high-level interface for Matplotlib that provides beautiful, informative statistical graphics. It works seamlessly with Pandas DataFrames.
- Use Case: Creating box plots to compare gene expression between two conditions, or a heatmap to show correlations between genes.
Example (Creating a box plot with Seaborn):
import seaborn as sns
import matplotlib.pyplot as plt
# Assume 'df' is a pandas DataFrame with expression data
# 'condition' is a column with labels (e.g., 'control', 'treated')
# 'gene_expr' is a column with numerical expression values
sns.boxplot(x='condition', y='gene_expr', data=df)
plt.title("Gene Expression by Condition")
plt.show()
Machine Learning & Statistics
-
Scikit-learn: The most popular machine learning library in Python. It provides simple and efficient tools for data mining and data analysis.
- Use Case: Building a classifier to predict disease status based on gene expression, or clustering genes with similar expression patterns (e.g., K-Means).
-
SciPy: A library used for scientific and technical computing. It contains modules for optimization, linear algebra, integration, and statistics.
- Use Case: Performing a statistical test (like a t-test) to see if the difference in gene expression between two groups is significant.
Common Bioinformatics Tasks with Python
Here’s how you can use these libraries to solve real-world problems.
Task 1: Analyzing FASTQ Files (Raw Sequencing Data)
FASTQ files contain both the sequence and its quality scores.
- Goal: Calculate average quality scores for all reads in a file and plot them.
- Libraries:
pysamorBio.SeqIO(for parsing),matplotliborseaborn(for plotting). - Process:
- Parse the FASTQ file, reading each record.
- For each record, convert the quality string (e.g.,
IIIIIIII...) into numerical Phred scores. - For each position in the read, calculate the average quality across all reads.
- Plot the average quality score versus the read position.
Task 2: Differential Gene Expression Analysis
- Goal: Identify genes that are significantly up-regulated or down-regulated in a disease state compared to a healthy control.
- Libraries:
pandas(for loading count data),scipy.statsorstatsmodels(for statistical testing),seaborn(for visualization). - Process:
- Load a gene count matrix (rows = genes, columns = samples) into a Pandas DataFrame.
- Use a statistical test (like a t-test or a more advanced method like DESeq2, which has a Python wrapper) to compare gene counts between the "disease" and "control" groups.
- Adjust the resulting p-values for multiple testing (e.g., using the Benjamini-Hochberg procedure).
- Identify genes with a low adjusted p-value (e.g., < 0.05) and a large fold-change.
- Visualize the results with a volcano plot or a heatmap.
Task 3: Building a Simple Phylogenetic Tree
- Goal: Determine the evolutionary relationship between a set of DNA sequences.
- Libraries:
Biopython(for alignment and tree manipulation),ETE Toolkit(for beautiful tree visualization). - Process:
- Use
Bio.Align.Applicationsto call an external aligner likeClustalOmegaorMAFFTto align your sequences. - Read the alignment file using
Bio.AlignIO. - Use
Bio.Phylo.TreeConstructionto build a distance tree (e.g., using the Neighbor-Joining algorithm). - Use the
ETElibrary to draw and annotate the tree.
- Use
How to Get Started: A Learning Path
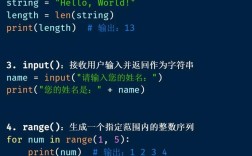
- Learn Python Fundamentals: Master variables, data types (lists, dictionaries), loops, conditionals, and functions.
- Dive into Core Libraries: Get comfortable with NumPy and especially Pandas. They are used in almost every data analysis task.
- Master Biopython: Work through the Biopython Tutorial. Try its examples for reading/writing files and performing simple sequence operations.
- Learn Data Visualization: Start with Matplotlib, then move to Seaborn for more complex and aesthetically pleasing plots.
- Tackle a Small Project: Find a small, interesting dataset (e.g., from a public repository like GEO or SRA) and try to answer a simple biological question with it. This is the best way to solidify your skills.
Useful Resources
- Books:
- Bioinformatics Programming Using Python by Mitchell L. Model
- Python for Bioinformatics by Sebastian Bassi
- Online Courses:
- Coursera/edX courses on Bioinformatics or Data Science often use Python.
- The Software Carpentry lessons have excellent Python for data science tutorials.
- Websites:
- Biopython Wiki: The official documentation and tutorials.
- The Python Bioinformatics Stack: A curated list of bioinformatics libraries.
- Real Python: Fantastic in-depth tutorials on Python and its libraries.