Of course! Debugging Python code in Eclipse is a powerful way to find and fix bugs. The primary tool for this is the PyDev plugin, which turns the Eclipse IDE into a full-fledged Python development environment.

Here is a comprehensive guide covering everything from setup to advanced debugging techniques.
Part 1: Setting Up Your Environment
Before you can debug, you need a working Python development environment in Eclipse.
Step 1: Install Eclipse
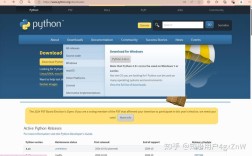
If you don't have Eclipse, download it from the official website. The "Eclipse IDE for Enterprise Java and Web Developers" or "Eclipse for RCP and RAP Developers" are good choices as they include the necessary base features.
Step 2: Install the PyDev Plugin
- Launch Eclipse.
- Go to
Help->Install New Software.... - In the "Work with" field, paste the PyDev update site URL:
http://pydev.org/updates - Eclipse will fetch the available software. You should see "PyDev". Select it and click
Next. - Review the installation details and accept the license agreements to complete the installation.
- Eclipse will prompt you to restart. Click
Restart Now.
Step 3: Configure the Python Interpreter
PyDev needs to know where your Python installation is located.

- Go to
Window->Preferences(on macOS,Eclipse->Settings). - Navigate to
PyDev->Interpreter - Python. - Click
Newto add a new interpreter. - In the "Interpreter Name" field, give it a name like
Python 3.9. - Click
Browse...and navigate to your Python executable. This is usually namedpython.exeon Windows orpythonon macOS/Linux. You can find it by typingwhich python(macOS/Linux) orwhere python(Windows) in your terminal. - Click
OK, thenApply and Close.
You have now successfully set up your environment!
Part 2: The Basics of Debugging
Let's create a simple Python script to debug.
Step 1: Create a Python Project
- Go to
File->New->PyDev Project. - Give your project a name (e.g.,
DebugDemo). - Ensure the "Interpreter" you just configured is selected.
- Click
Finish.
Step 2: Create a Python Script
- Right-click on your project in the "Project Explorer" and go to
New->PyDev Module. - Name the file
buggy_script.pyand clickFinish. - Paste the following code into the file. It's intentionally buggy.
# buggy_script.py
def find_average(numbers):
    """Calculates the average of a list of numbers."""
    if not numbers:
        print("Warning: The list is empty!")
        return 0
    total = 0
    for i in range(len(numbers)): # Bug: Should be `for num in numbers`
        total += i # Bug: Should be `total += numbers[i]` or `total += num`
    average = total / len(numbers)
    return average
if __name__ == "__main__":
    my_numbers = [10, 20, 30, 40, 50]
    print(f"Calculating average for: {my_numbers}")
    avg = find_average(my_numbers)
    print(f"The average is: {avg}") # This will print the wrong value
    # Let's test the empty list case
    empty_list = []
    avg_empty = find_average(empty_list)
    print(f"The average of an empty list is: {avg_empty}")
Part 3: Using the Eclipse Debugger
The Eclipse debugger uses breakpoints to pause your program's execution so you can inspect its state.
Step 1: Set a Breakpoint
A breakpoint is a marker that tells the debugger to stop the program at a specific line.

- Open
buggy_script.py. - Double-click in the grey margin to the left of the line
avg = find_average(my_numbers). A blue dot will appear, indicating a breakpoint has been set.
Step 2: Start a Debug Session
There are two ways to start debugging:
- Right-click on the file in the "Project Explorer" and select
Debug As->Python Run. - Use the Debug icon in the toolbar (it looks like a small bug).
The first time you do this, Eclipse will ask you to switch to the "Debug Perspective". Click Switch. This perspective is optimized for debugging, showing you several key views.
Step 3: Understand the Debug Perspective
You will see your code paused at the breakpoint. The line with the breakpoint is highlighted. You will also see several new views:
- Debug View (Top Left): Shows the call stack. You can see which functions have called which other functions. You can also see the variables for the currently selected stack frame.
- Variables View (Top Right): This is where you inspect the state of your program. It lists all the variables in the current scope and their current values. You can expand lists and objects to see their contents.
- Editor View (Center): Your code, with the current line highlighted.
- Console View (Bottom): Shows the program's standard output (like
print()statements).
Step 4: Control Program Execution
The debugger's control bar at the top has several important buttons:
- (Resume) F8: Continues execution until the next breakpoint is hit or the program finishes.
- (Step Into) F5: Steps into a function call. If the current line calls another function, it will jump to the first line of that function.
- (Step Over) F6: Executes the current line of code and moves to the next line. If the line is a function call, it will execute the entire function without stepping into it. This is the most commonly used button.
- (Step Return) F7: Finishes executing the current function and returns to the line that called it.
- (Terminate) □: Stops the debugging session entirely.
- (Disconnect) ⏹: Detaches the debugger from the running process, which will continue to run until it finishes.
Step 5: Debugging the Bug
Let's find the bug in our code.
- The program is paused at
avg = find_average(my_numbers). - Look at the Variables view. You can see
my_numbersis[10, 20, 30, 40, 50]. - Click the Step Over (F6) button. The program will execute the line and move to the next one:
print(f"The average is: {avg}"). - Look at the Variables view again. Notice the variable
avghas been created. What is its value? It's0. This is clearly wrong. The bug is inside thefind_averagefunction. - To inspect the function, we need to go back. Click Terminate (□) to stop the current session.
- Set a new breakpoint inside the
find_averagefunction, for example, on the linetotal = 0. - Start the debug session again.
- When the program pauses at
total = 0, click Step Over (F6) a few times.- After the first
for i in range(len(numbers)), the variableiis0. - After the next line
total += i, the variabletotalbecomes0. - After the next loop iteration,
ibecomes1, andtotalbecomes1. - You can immediately see the problem: we are adding the loop index
ito the total, not the actual numbers from the list!
- After the first
Step 6: Inspecting Variables and Expressions
Sometimes you want to check a value that isn't a simple variable.
- In the Variables view: Right-click on a variable and select "Display Value" or "Watch".
- Using the "Expressions" view: At the bottom of the Debug perspective, there's an "Expressions" view. You can type any Python expression here (e.g.,
numbers[i]ortotal + 100) and see its evaluated value in real-time.
Part 4: Advanced Debugging Features
Conditional Breakpoints
You don't want the debugger to stop every time a loop runs. You can make a breakpoint conditional.
- Right-click on the blue breakpoint dot in the margin.
- Select Breakpoint Properties.
- Check "Conditional" and enter a condition (e.g.,
i == 2). - Click "Apply and Close". The dot will now have a
>symbol on it. Now, the debugger will only pause when the breakpoint is reached and the conditioni == 2is true.
Watchpoints
A watchpoint pauses the program's execution when a variable is modified, not just when it's accessed.
- Right-click on a variable in the editor or the Variables view.
- Select Toggle Watchpoint.
- In the dialog, choose "Access" (to pause on read) or "Modification" (to pause on write). This is incredibly useful for finding where a variable is being unexpectedly changed.
Attaching to a Running Process
Sometimes you want to debug a program that is already running.
- Start your Python script normally from the terminal (e.g.,
python buggy_script.py). - In Eclipse, go to
Run->Debug Configurations.... - Select "PyDev Remote Debug Client" on the left and click
New. - Give the configuration a name.
- The host is usually
localhost. The port can be any free port (e.g.,5678). - Click
Applyand then Debug. - The "Debug" view will show "Waiting for process to connect...".
- Go back to your terminal. You need to tell your running Python script to connect to this debugger. The easiest way is with the
pydevd-pycharmpackage.pip install pydevd-pycharm
Then, at the beginning of your script, add:
import pydevd_pycharm
pydevd_pycharm.settrace('localhost', port=5678, stdoutToServer=True, stderrToServer=True)
When this line is executed in your running script, it will connect to Eclipse, and you will gain full debugging control.
Summary of Shortcuts
| Action | Shortcut (Windows/Linux) | Shortcut (macOS) |
|---|---|---|
| Resume | F8 | F8 |
| Step Over | F6 | F6 |
| Step Into | F5 | F5 |
| Step Return | F7 | F7 |
| Toggle Breakpoint | Double-click margin | Double-click margin |
| Show Tooltip | Hover over variable | Hover over variable |
Mastering these features will make you a much more efficient Python developer. Happy debugging