Of course! Generating a "dump" in Java on Linux is a critical skill for debugging issues like OutOfMemoryError, deadlocks, or high CPU usage. A dump is a snapshot of the JVM's state at a specific moment.

Let's break down the different types of dumps, how to generate them, and how to analyze them.
The Three Main Types of Java Dumps
It's crucial to understand the difference between these three, as they serve very different purposes.
| Dump Type | What It Is | Best For | How to Generate |
|---|---|---|---|
| Thread Dump (or Java Core Dump) | A text file showing the state of every thread in the JVM. | Deadlocks, performance bottlenecks, high CPU. Identifies what threads are doing, waiting for, or holding locks. | jstack, jcmd, kill -3 |
| Heap Dump | A binary file containing a snapshot of all the objects in memory. | OutOfMemoryError, memory leaks. Shows what objects are consuming memory and who is holding references to them. | jmap, jcmd, -XX:+HeapDumpOnOutOfMemoryError |
| Core Dump | A low-level operating system dump of the entire JVM process memory. | JVM crashes (SIGSEGV, SIGILL), fatal errors. Used by the JVM developers to diagnose native code issues. | gcore, kill -6, ulimit -c |
Generating Thread Dumps (for Deadlocks & Performance)
A thread dump shows you the call stack of every thread. This is your first line of defense for performance issues.
Method 1: jstack (The Classic Tool)
This is the most common way to generate a thread dump for a running process.

Find the Java Process ID (PID):
# Shows all java processes with their PIDs
jps -l
# Or use ps to get more details
ps -ef | grep java
You'll get an output like this:
12345 /path/to/your/java/app.jarThe number 12345 is the PID.
Generate the Thread Dump:

# Generate a single thread dump to a file
jstack -l <PID> > threaddump_$(date +%Y%m%d_%H%M%S).txt
# Or print it directly to the console
jstack -l <PID>
-lis a good habit to use as it includes lock information.
Generate Multiple Dumps Over Time (Very Useful): To diagnose a performance issue, you need to see how threads change over time. A script is perfect for this.
#!/bin/bash
PID=12345  # <-- Set your Java PID here
# Generate a thread dump every 5 seconds, 10 times
for i in {1..10}
do
   echo "Generating thread dump #$i at $(date)"
   jstack -l $PID > threaddump_$i_$(date +%Y%m%d_%H%M%S).txt
   sleep 5
done
Method 2: jcmd (The Modern, More Powerful Tool)
jcmd is part of the JDK and can perform many diagnostics tasks without needing a separate tool.
List available commands for a JVM:
jcmd <PID> help
Generate a thread dump:
# This is the easiest way
jcmd <PID> Thread.print > threaddump_jcmd_$(date +%Y%m%d_%H%M%S).txt
# You can also use the 'GC.class_histogram' command to get a heap summary
jcmd <PID> GC.class_histogram
Method 3: kill -3 (The Universal Signal)
This method works on any OS and doesn't require you to know which JDK tools are installed. It sends a signal to the JVM, which causes it to print the thread dump to its standard output (usually the console or a log file).
# Find your PID
ps -ef | grep java
# Send the signal
kill -3 <PID>
If your application is running in the foreground, the dump will appear on your screen. If it's running as a service (e.g., Tomcat, WebLogic), the dump will typically be written to the catalina.out or stdout log file.
Generating Heap Dumps (for Memory Issues)
A heap dump shows you all the objects in memory and their relationships. This is essential for finding OutOfMemoryError and memory leaks.
Method 1: -XX:+HeapDumpOnOutOfMemoryError (The Best Practice)
This is the most reliable method because it generates a heap dump at the exact moment the application runs out of memory.
Set this JVM flag when you start your application:
java -Xmx512m -XX:+HeapDumpOnOutOfMemoryError -XX:HeapDumpPath=/var/log/myapp/ java MyApp
-Xmx512m: Sets the max heap to 512MB.-XX:+HeapDumpOnOutOfMemoryError: Enables the heap dump on OOM.-XX:HeapDumpPath=/var/log/myapp/: Specifies where to save the dump file. The default is the working directory of the JVM.
When an OutOfMemoryError occurs, a file named something like java_pid12345.hprof will be created at the specified path.
Method 2: jcmd (While the Application is Running)
You can trigger a heap dump manually while the application is still running (though this can cause a brief pause).
# Trigger a heap dump for PID 12345
jcmd <PID> GC.heap_dump /path/to/heapdump.hprof
Method 3: jmap (Use with Caution)
jmap can force a heap dump, but it can be very dangerous on a running production server as it can pause the entire JVM for a significant amount of time.
# WARNING: Can be very slow and pause the JVM!
jmap -dump:format=b,file=/path/to/heapdump.hprof <PID>
Prefer jcmd for live heap dumps.
Generating Core Dumps (for JVM Crashes)
A core dump is a low-level memory snapshot of the crashed process. You should only use this if the JVM itself has crashed with a fatal error (e.g., SIGSEGV, segmentation fault).
Step 1: Enable Core Dumps in Linux
By default, many Linux systems limit core dump size to 0. You need to configure this system-wide or for a specific user.
System-wide (requires root):
# Set the core file pattern to include the PID
echo "|/usr/bin/gcore -o %p.core %p" > /proc/sys/kernel/core_pattern
# Or a simpler pattern that saves files to /tmp
echo "/tmp/core-%e-%p" > /proc/sys/kernel/core_pattern
%pis replaced by the PID.%eis replaced by the executable name.gcoreis often preferred as it's less likely to crash the system itself.
For a single user (add to ~/.bashrc or ~/.bash_profile):
ulimit -c unlimited
This command tells the shell to allow unlimited-sized core dumps for processes started from this shell.
Step 2: Trigger the Core Dump
If the JVM is crashing, it will generate a core dump automatically when it receives a fatal signal like SIGSEGV (Segmentation Fault). You can also force one manually.
# Find the PID of the Java process
PID=12345
# Send SIGABRT to the process. This will cause it to crash and generate a core dump.
kill -6 <PID>
After this, a core dump file (e.g., core.12345 or java-12345.core) will be created in the directory specified by core_pattern or the current working directory of the process.
Analyzing the Dumps
You've generated the dump, now what?
Analyzing Thread Dumps
- For Deadlocks: Look for a section labeled
"Found one deadlock". It will clearly show the threads and the locks they are waiting for vs. the locks they are holding. - For Performance:
- Look for threads that are in
RUNNABLEstate for a long time. These are consuming CPU. - Look for many threads stuck in
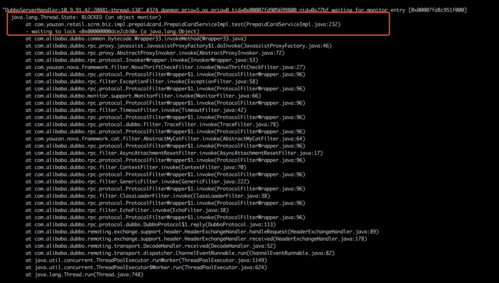
WAITINGorTIMED_WAITINGon the same lock. This is a bottleneck. - Count the number of threads. Are there too many? (e.g., thousands of threads).
- Look at the stack trace of
RUNNABLEthreads to see what code they are executing.
- Look for threads that are in
Analyzing Heap Dumps
You need a specialized tool for this. Eclipse MAT (Memory Analyzer Tool) is the industry standard and is free.
- Download and install Eclipse MAT.
- Open the
.hproffile in MAT. - Run the "Leak Suspects" report. This is a powerful analysis that automatically points you to the areas of memory that are most likely causing the problem. It will often tell you exactly which object and which part of your code is holding onto too much memory.
Analyzing Core Dumps
This is an advanced task usually done by JVM engineers or developers of native code.
- Get the exact same JVM version that produced the core dump (including the patch version).
- Use the
jhsdbtool (included in the JDK) orgdbto inspect the core file.
Example using jhsdb:
# Assumes you have the core file 'core.12345' and the JDK is in /path/to/jdk
/path/to/jdk/bin/jhsdb jcore --exe /path/to/jdk/bin/java --core core.12345
This will open an interactive debugger where you can inspect the JVM's internal state at the time of the crash. You would typically look at the stack trace of the crashing thread to find the root cause in the native code.


