Of course! Here's a comprehensive guide on using QCustomPlot with Python, including installation, a basic example, explanations of key concepts, and more advanced features.

What is QCustomPlot?
QCustomPlot is a Qt C++ widget for plotting data. It's highly praised for its performance, flexibility, and rich set of features. It's not a standalone plotting library; it's designed to be embedded within a Qt application.
While it's a C++ library, we can use it in Python through a PyQt/PySide wrapper. The most common and well-maintained wrapper is qcustomplot-py.
Installation
You need to install both the Qt bindings for Python and the qcustomplot-py wrapper itself.
Step 1: Install PyQt or PySide
QCustomPlot is a Qt widget, so you need a Qt binding. PyQt5/PyQt6 or PySide2/PySide6 will work.

# Using PyQt5 (recommended for wider compatibility with qcustomplot-py)
pip install PyQt5
# Or using PySide2
pip install PySide2
# For Qt6 versions
pip install PyQt6
pip install PySide6
Step 2: Install qcustomplot-py
This package provides the Python wrapper for the C++ QCustomPlot library.
pip install qcustomplot-py
A Simple Plotting Example (PyQt5)
This example will create a window with a simple sine wave plot. It demonstrates the fundamental steps of creating a plot with QCustomPlot.
import sys
import numpy as np
from PyQt5.QtWidgets import QApplication, QMainWindow, QVBoxLayout, QWidget
from qcustomplot import QCustomPlot
class MainWindow(QMainWindow):
    def __init__(self):
        super().__init__()
        self.setWindowTitle("QCustomPlot Simple Sine Wave")
        self.setGeometry(100, 100, 800, 600)
        # Create a widget and a layout to hold the QCustomPlot
        central_widget = QWidget()
        self.setCentralWidget(central_widget)
        layout = QVBoxLayout()
        central_widget.setLayout(layout)
        # Instantiate QCustomPlot
        self.custom_plot = QCustomPlot()
        layout.addWidget(self.custom_plot)
        # 1. Generate data
        x = np.linspace(0, 10, 100)
        y = np.sin(x)
        # 2. Create a graph and assign data to it
        #    The first argument is the key for the graph, which we can use later to access it.
        self.custom_plot.addGraph()
        self.custom_plot.graph(0).setData(x, y)
        # 3. Customize the plot (optional but recommended)
        self.custom_plot.xAxis.setLabel("X Axis")
        self.custom_plot.yAxis.setLabel("Y Axis")
        self.custom_plot.xAxis.setRange(0, 10)
        self.custom_plot.yAxis.setRange(-1.1, 1.1)
        self.custom_plot.legend.setVisible(True)
        self.custom_plot.graph(0).setName("Sine Wave")
        # 4. Replot to update the widget
        self.custom_plot.replot()
if __name__ == "__main__":
    app = QApplication(sys.argv)
    main_window = MainWindow()
    main_window.show()
    sys.exit(app.exec_())
How to Run the Example:
- Save the code as
simple_plot.py. - Run it from your terminal:
python simple_plot.py.
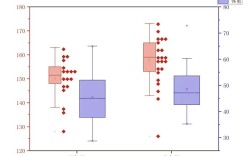
You should see a window like this:
Key Concepts and Code Breakdown
Let's break down the essential parts of the example.
QCustomPlot Widget
This is the main widget that holds your plot. You add it to your application's layout just like any other Qt widget (QPushButton, QLabel, etc.).
Graphs (addGraph, graph, setData)
A single QCustomPlot widget can hold multiple graphs (e.g., a sine wave and a cosine wave on the same axes).
self.custom_plot.addGraph(): Creates a new graph and returns its integer ID. The first graph has ID0, the second1, and so on.self.custom_plot.graph(0): Returns the graph object with the given ID.graph.setData(x_data, y_data): Assigns the data to the graph.x_dataandy_datamust be sequences (like lists or NumPy arrays) of the same length.
Axes (xAxis, yAxis)
You access the X and Y axes through custom_plot.xAxis and custom_plot.yAxis. Each axis is an object with its own properties.
setLabel("Text"): Sets the axis label.setRange(min, max): Sets the visible range of the axis.setTicks(True/False): Shows or hides the tick marks.setTickLabelRotation(angle): Rotates the tick labels.
Replotting (replot)
QCustomPlot does not automatically update its display when you change data or properties. You must explicitly call replot() to redraw the widget. This is an important performance feature, as it allows you to make many changes and then update the screen only once.
More Advanced Features
Multi-Graph and Multiple Axes
This example plots a sine and a cosine wave on the same plot and adds a second Y-axis on the right for the cosine wave.
# ... (imports and MainWindow setup are the same) ...
    def __init__(self):
        super().__init__()
        # ... (window setup) ...
        self.custom_plot = QCustomPlot()
        layout.addWidget(self.custom_plot)
        # 1. Generate data
        x = np.linspace(0, 10, 200)
        y1 = np.sin(x)
        y2 = np.cos(x)
        # 2. Create two graphs
        self.custom_plot.addGraph() # Graph 0 for Sine
        self.custom_plot.addGraph() # Graph 1 for Cosine
        # 3. Assign data to graphs
        self.custom_plot.graph(0).setData(x, y1)
        self.custom_plot.graph(1).setData(x, y2)
        # 4. Customize the plot
        self.custom_plot.xAxis.setLabel("Time (s)")
        self.custom_plot.yAxis.setLabel("Sine Amplitude")
        self.custom_plot.xAxis.setRange(0, 10)
        self.custom_plot.yAxis.setRange(-1.1, 1.1)
        # --- KEY: Setup the second (right) axis ---
        self.custom_plot.yAxis2.setLabel("Cosine Amplitude")
        self.custom_plot.yAxis2.setRange(-1.1, 1.1)
        self.custom_plot.yAxis2.setVisible(True) # Make it visible
        # Link the right axis to the second graph
        self.custom_plot.graph(1).setValueAxis(self.custom_plot.yAxis2)
        # Set colors and names for legend
        self.custom_plot.graph(0).setName("Sine")
        self.custom_plot.graph(0).setPen(color=(255, 0, 0)) # Red
        self.custom_plot.graph(1).setName("Cosine")
        self.custom_plot.graph(1).setPen(color=(0, 0, 255)) # Blue
        self.custom_plot.legend.setVisible(True)
        self.custom_plot.replot()
Real-Time Plotting (Updating Data Dynamically)
For real-time data, you should avoid replotting the entire graph every time. Instead, update the data and call replot().
A crucial method for performance is setData(x, y, True). The third argument True tells QCustomPlot that the data sizes haven't changed, which is much faster.
import sys
import time
import numpy as np
from PyQt5.QtWidgets import QApplication, QMainWindow, QVBoxLayout, QWidget
from qcustomplot import QCustomPlot
class RealTimePlotWindow(QMainWindow):
    def __init__(self):
        super().__init__()
        self.setWindowTitle("Real-Time Plot")
        self.setGeometry(100, 100, 800, 600)
        central_widget = QWidget()
        self.setCentralWidget(central_widget)
        layout = QVBoxLayout()
        central_widget.setLayout(layout)
        self.custom_plot = QCustomPlot()
        layout.addWidget(self.custom_plot)
        # Initial data
        self.x_data = np.arange(0, 100, 1)
        self.y_data = np.zeros(100)
        self.custom_plot.addGraph()
        self.custom_plot.graph(0).setData(self.x_data, self.y_data)
        self.custom_plot.xAxis.setLabel("Time")
        self.custom_plot.yAxis.setLabel("Value")
        self.custom_plot.xAxis.setRange(0, 100)
        self.custom_plot.yAxis.setRange(-1.1, 1.1)
        self.custom_plot.replot()
        # Start a timer to update the plot
        self.timer = self.startTimer(50) # Update every 50 ms
    def timerEvent(self, event):
        if event.timerId() == self.timer:
            # Shift data to the left and add a new point
            self.y_data[:-1] = self.y_data[1:]
            self.y_data[-1] = np.sin(time.time()) # New data point
            # Update the graph's data efficiently
            self.custom_plot.graph(0).setData(self.x_data, self.y_data, True)
            # Rescale axes to fit (optional)
            self.custom_plot.xAxis.setRange(self.x_data[0], self.x_data[-1])
            # Replot
            self.custom_plot.replot()
if __name__ == "__main__":
    app = QApplication(sys.argv)
    window = RealTimePlotWindow()
    window.show()
    sys.exit(app.exec_())
Interactivity
QCustomPlot has built-in interactivity that you can enable:
setInteractions(QCP::iRangeDrag | QCP::iRangeZoom): Allows users to drag to pan and scroll to zoom.setSelectableParts(QCP::spAxis | QCP::spLegend): Allows users to click on axes or the legend to select them.
# In your __init__ method after creating the plot:
self.custom_plot.setInteractions(QCP.iRangeDrag | QCP.iRangeZoom)
Troubleshooting and Tips
- ModuleNotFoundError: No module named 'qcustomplot': This means
qcustomplot-pyis not installed correctly. Runpip install qcustomplot-pyagain. - AttributeError: 'QCustomPlot' object has no attribute '...': You might be using a method that doesn't exist or misspelling a property. Check the
qcustomplot-pydocumentation or the original C++ documentation for reference. - The plot is blank or tiny: You probably forgot to call
replot(). Also, ensure you have set a reasonable range for your axes withsetRange(). - NumPy is your friend:
QCustomPlotworks great with NumPy arrays. Usenp.linspace(),np.sin(), etc., for easy data generation. - Performance: For very large datasets (millions of points), consider using
QCPGraph::setData(..., copy=True)carefully or looking intoQCPGraph::setScatterStyle()with aQCPScatterStyle::ssDotstyle, as rendering individual lines for millions of points can be slow. For truly massive data, consider downsampling before plotting.