Of course! The phrase "Python Excel style" can mean a few different things, but it generally refers to using Python libraries to perform tasks that you would typically do in Microsoft Excel.

Here’s a breakdown of the most common interpretations, from the most direct (reading/writing Excel files) to the more powerful (data manipulation in a "spreadsheet" style).
The Most Direct Answer: Reading and Writing Excel Files
This is the most common use case. You want to automate creating, reading, or modifying .xlsx files.
The Go-To Library: openpyxl
openpyxl is the most popular library for this task. It's powerful, well-documented, and can handle everything from simple formulas to complex styling.
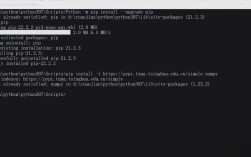
Installation:

pip install openpyxl
Example: Creating a Styled Excel File
This script creates a new Excel file, writes some data, and applies formatting, just like you would manually in Excel.
import openpyxl
from openpyxl.styles import Font, PatternFill, Alignment
from openpyxl.utils import get_column_letter
# 1. Create a new workbook and select the active sheet
wb = openpyxl.Workbook()
ws = wb.active= "Sales Report"
# 2. Write headers (like A1, B1, C1)
headers = ["Product", "Q1 Sales", "Q2 Sales", "Total"]
for col_num, header in enumerate(headers, 1):
    ws.cell(row=1, column=col_num, value=header)
# 3. Write some data
data = [
    ["Laptop", 50000, 75000],
    ["Mouse", 15000, 20000],
    ["Keyboard", 25000, 30000],
]
for row_num, row_data in enumerate(data, 2): # Start from row 2
    for col_num, value in enumerate(row_data, 1):
        ws.cell(row=row_num, column=col_num, value=value)
    # Calculate and write the 'Total' in column 4
    total = sum(row_data)
    ws.cell(row=row_num, column=4, value=total)
# 4. Apply Styling (The "Excel Style" part)
# Style the header row
header_font = Font(bold=True, color="FFFFFF")
header_fill = PatternFill(start_color="366092", end_color="366092", fill_type="solid")
header_alignment = Alignment(horizontal="center", vertical="center")
for cell in ws[1]:
    cell.font = header_font
    cell.fill = header_fill
    cell.alignment = header_alignment
# Style the 'Total' column
total_font = Font(bold=True, color="FF0000") # Red and bold
for row in range(2, len(data) + 2):
    ws.cell(row=row, column=4).font = total_font
# Auto-adjust column widths
for col in range(1, len(headers) + 1):
    col_letter = get_column_letter(col)
    ws.column_dimensions[col_letter].width = 15
# 5. Save the file
wb.save("sales_report.xlsx")
print("Excel file 'sales_report.xlsx' created successfully!")
What the output (sales_report.xlsx) looks like:
| Product | Q1 Sales | Q2 Sales | Total |
|---|---|---|---|
| Laptop | 50000 | 75000 | 125000 |
| Mouse | 15000 | 20000 | 35000 |
| Keyboard | 25000 | 30000 | 55000 |
The Data Analyst's Answer: Working with DataFrames (The "Pandas" Way)
For most data analysis tasks, you don't want to loop through cells. You want to work with data as a whole. This is where the Pandas library shines. It's the standard for data manipulation in Python and works seamlessly with Excel files.

Think of a Pandas DataFrame as a super-powered, in-memory version of an Excel sheet.
Installation:
pip install pandas openpyxl # openpyxl is the engine pandas uses for .xlsx files
Example: Reading, Analyzing, and Writing Data
This script reads the Excel file we just created, performs calculations, and writes the result to a new sheet.
import pandas as pd
# 1. Read the Excel file into a DataFrame
# Pandas automatically detects headers and reads the data into a structured format.
df = pd.read_excel("sales_report.xlsx", sheet_name="Sales Report")
print("--- Original Data ---")
print(df)
print("\n" + "="*30 + "\n")
# 2. Perform "Excel-style" calculations on the DataFrame
# Calculate the average sales for Q1 and Q2
avg_q1 = df['Q1 Sales'].mean()
avg_q2 = df['Q2 Sales'].mean()
# Add a new column for the annual forecast (Total * 1.1)
df['Annual Forecast'] = df['Total'] * 1.1
print("--- Data with New Calculations ---")
print(df)
print(f"\nAverage Q1 Sales: {avg_q1:,.2f}")
print(f"Average Q2 Sales: {avg_q2:,.2f}")
print("\n" + "="*30 + "\n")
# 3. Write the modified DataFrame back to a new Excel file
# We can use the ExcelWriter to add multiple sheets to one file.
with pd.ExcelWriter("sales_report_with_pandas.xlsx", engine='openpyxl') as writer:
    # Write the original data to a sheet named "Original"
    pd.read_excel("sales_report.xlsx", sheet_name="Sales Report").to_excel(writer, sheet_name="Original", index=False)
    # Write the modified DataFrame to a sheet named "Analysis"
    df.to_excel(writer, sheet_name="Analysis", index=False)
    # We can even add a summary sheet!
    summary_data = {
        "Metric": ["Average Q1 Sales", "Average Q2 Sales", "Total Forecast"],
        "Value": [avg_q1, avg_q2, df['Annual Forecast'].sum()]
    }
    summary_df = pd.DataFrame(summary_data)
    summary_df.to_excel(writer, sheet_name="Summary", index=False)
print("New Excel file 'sales_report_with_pandas.xlsx' created successfully!")
The Power User's Answer: The polars Library
For very large datasets, polars is a modern, extremely fast DataFrame library that is often a drop-in replacement for Pandas. It's written in Rust and can outperform Pandas significantly on big data.
Installation:
pip install polars
Example: The same analysis, but with polars
import polars as pl
# 1. Read the Excel file
# Polars can read Excel files directly, but it's often faster to convert to CSV first for huge files.
df = pl.read_excel("sales_report.xlsx")
print("--- Original Data (Polars) ---")
print(df)
print("\n" + "="*30 + "\n")
# 2. Perform calculations (syntax is very similar to Pandas)
# Polars expressions are lazy by default, which is part of its speed advantage.
analysis_df = df.with_columns(
    (pl.col("Total") * 1.1).alias("Annual Forecast")
).select([
    "Product",
    "Q1 Sales",
    "Q2 Sales",
    "Total",
    "Annual Forecast"
])
print("--- Data with New Calculations (Polars) ---")
print(analysis_df)
print("\n" + "="*30 + "\n")
# 3. Write to a new Excel file
analysis_df.write_excel("sales_report_with_polars.xlsx")
print("New Excel file 'sales_report_with_polars.xlsx' created successfully!")
Summary: Which one should you use?
| Task | Recommended Library | Why? |
|---|---|---|
| Simple Read/Write | pandas |
Easiest syntax for loading data into a structured format. |
| Complex Formatting | openpyxl |
Full control over cell styles, charts, images, and formulas. |
| Data Analysis | pandas or polars |
The standard for filtering, grouping, aggregating, and transforming data. Use polars for speed on large datasets. |
| Automation | pandas + openpyxl |
A common pattern: use pandas for analysis and openpyxl to add final formatting to the output file. |
For most users, learning Pandas is the single best investment for "Excel style" work in Python. It's the bridge between raw data files and powerful analysis. If you also need to make your output files look pretty, learn openpyxl for the final styling touches.