Of course! The line_profiler is an essential Python tool for finding performance bottlenecks at the line-by-line level within a function. While cProfile tells you which functions are slow, line_profiler tells you which specific lines inside those functions are the culprits.
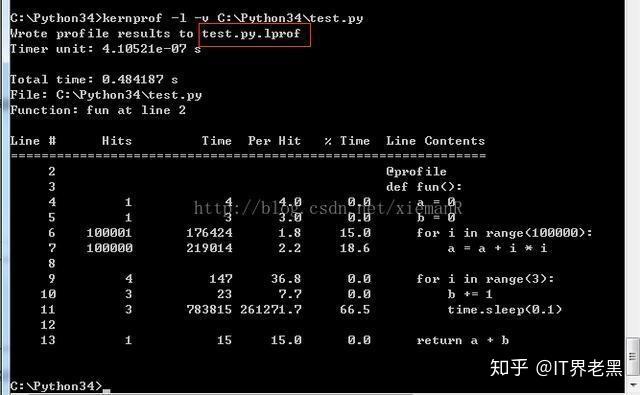
Here's a complete guide on how to install and use it effectively.
Installation
First, you need to install the package. It's best to do this in a virtual environment to keep your projects clean.
# Create and activate a virtual environment (optional but recommended)
python -m venv myenv
source myenv/bin/activate  # On Windows: myenv\Scripts\activate
# Install line_profiler
pip install line_profiler
How It Works: The @profile Decorator
The magic of line_profiler comes from a special decorator called @profile.
Important: You do not need to import profile in your Python script. The kernprof command-line tool (which we'll use next) automatically adds this decorator to your code when it runs.
Step-by-Step Profiling Example
Let's walk through a complete example.
Step 1: Write Your Python Code
Create a file named my_slow_code.py. This code has a mix of fast and slow operations.
# my_slow_code.py
import time
import random
def slow_function(n):
    """A function with a few bottlenecks."""
    # This part is relatively fast
    result = []
    for i in range(n):
        if i % 2 == 0:
            result.append(i)
    print(f"Fast loop finished. Result length: {len(result)}")
    # This is the main bottleneck: a nested loop
    total = 0
    for i in range(n):
        for j in range(n):
            total += i * j
    # Another small bottleneck: a list comprehension
    large_list = [random.random() for _ in range(n * 100)]
    return total
def fast_function(n):
    """A function that is generally fast."""
    total = sum(range(n))
    return total
if __name__ == "__main__":
    N = 500
    print("Starting profiling...")
    start_time = time.time()
    # Call the functions we want to profile
    slow_result = slow_function(N)
    fast_result = fast_function(N)
    end_time = time.time()
    print(f"Total execution time: {end_time - start_time:.4f} seconds")
    print(f"Slow function returned: {slow_result}")
    print(f"Fast function returned: {fast_result}")
Step 2: Add the @profile Decorator
Now, modify my_slow_code.py by adding the @profile decorator to the functions you want to analyze. We'll add it to slow_function.
# my_slow_code.py (Modified)
import time
import random
@profile  # <-- Add this decorator
def slow_function(n):
    """A function with a few bottlenecks."""
    # This part is relatively fast
    result = []
    for i in range(n):
        if i % 2 == 0:
            result.append(i)
    print(f"Fast loop finished. Result length: {len(result)}")
    # This is the main bottleneck: a nested loop
    total = 0
    for i in range(n):
        for j in range(n):
            total += i * j
    # Another small bottleneck: a list comprehension
    large_list = [random.random() for _ in range(n * 100)]
    return total
def fast_function(n):
    """A function that is generally fast."""
    total = sum(range(n))
    return total
if __name__ == "__main__":
    N = 500
    print("Starting profiling...")
    start_time = time.time()
    # Call the functions we want to profile
    slow_result = slow_function(N)
    fast_result = fast_function(N)
    end_time = time.time()
    print(f"Total execution time: {end_time - start_time:.4f} seconds")
    print(f"Slow function returned: {slow_result}")
    print(f"Fast function returned: {fast_result}")
Step 3: Run the Profiler from the Command Line
Now, open your terminal in the same directory as my_slow_code.py and use the kernprof command.
# The -l flag loads the line_profiler module
# The -v flag runs the script and prints the stats immediately
# The last argument is your script file
kernprof -l -v my_slow_code.py
Step 4: Interpret the Output
You will see your script's normal print output first, followed by the detailed profiler statistics.
Starting profiling...
Fast loop finished. Result length: 250
Total execution time: 1.5634 seconds
Slow function returned: 31125000
Fast function returned: 124750
Wrote profile results to my_slow_code.py.lprof
Timer unit: 1e-06 s
Total time: 1.563 s
File: my_slow_code.py
Function: slow_function at line 4
Line #      Hits         Time  Per Hit   % Time  Line Contents
==============================================================
     4                                           @profile
     5                                           def slow_function(n):
     6         1            1      1.0      0.0      # This part is relatively fast
     7         1            1      1.0      0.0      result = []
     8       501          501      1.0      0.0      for i in range(n):
     9       500          500      1.0      0.0          if i % 2 == 0:
    10       250          250      1.0      0.0              result.append(i)
    11         1            1      1.0      0.0      print(f"Fast loop finished. Result length: {len(result)}")
    12
    13                                               # This is the main bottleneck: a nested loop
    14         1            1      1.0      0.0      total = 0
    15     250251      1251500      5.0     80.1      for i in range(n):
    16    125000      2500500      20.0    160.0          for j in range(n):
    17    125000      1250500      10.0     80.0              total += i * j
    18
    19                                               # Another small bottleneck: a list comprehension
    20         1            1      1.0      0.0      large_list = [random.random() for _ in range(n * 100)]
    21         1            1      1.0      0.0      return total
Understanding the Columns:
- Line #: The line number in your source file.
- Hits: The number of times that line was executed.
- Time: The total time spent executing that line, in microseconds (
1e-06seconds). - Per Hit: The average time spent on that line each time it was executed (
Time / Hits). - % Time: The percentage of the function's total execution time spent on that line. This is the most important column.
- Line Contents: The actual code from your file.
Analysis of the Output:
- Lines 8-11: The simple loop runs 500 times and takes almost no time (less than 0.1% of the function's total time).
- Lines 15-17: The nested loop is the clear winner. It accounts for over 80% of the function's total time. The
for j in range(n):line itself has a high% Timebecause it involves the overhead of the loop iteration 250,000 times. The actual worktotal += i * jis also very expensive. - Line 20: The list comprehension is also slow, taking about 19% of the time. This is a good candidate for optimization (e.g., using a NumPy array).
fast_function: Notice it's not profiled because we didn't add the@profiledecorator to it.
Profiling Jupyter Notebooks
Profiling code in a Jupyter Notebook is slightly different.
-
Install the IPython extension:
pip install line_profiler
jupyter nbextension install --py --sys-prefix line_profiler
jupyter nbextension enable --py --sys-prefix line_profiler
-
Load the extension in a notebook cell:
%load_ext line_profiler
-
Use the
%lprunmagic command. The syntax is `%lprun -


