Of course! The percentile() function is a crucial tool in data analysis and statistics, used to find a value below which a certain percentage of data in a dataset falls.

Let's break it down, from the basic concept to practical examples in Python.
What is a Percentile?
Imagine you have a list of exam scores for 100 students. If you are in the 90th percentile, it means you scored better than 90% of the students. In other words, only 10% of the students scored higher than you.
Key Points:
- It's a measure of relative standing.
- The 50th percentile is the same as the median (the middle value of the data).
- The 25th percentile is also known as the first quartile (Q1).
- The 75th percentile is the third quartile (Q3).
How to Calculate Percentile in Python
There are two primary ways to calculate percentiles in Python:

- Using the
NumPylibrary: The most common and recommended method for numerical data, especially when working with large arrays or dataframes. - Using the
statisticsmodule: A built-in Python module, good for simple lists but less flexible than NumPy.
Method 1: Using NumPy (Recommended)
NumPy is the standard for numerical computing in Python. Its numpy.percentile() function is powerful and efficient.
Installation
If you don't have NumPy installed, open your terminal or command prompt and run:
pip install numpy
Syntax
numpy.percentile(a, q, axis=None, out=None, overwrite_input=False, method='linear', keepdims=False)
a: The array or list of numbers to compute the percentile for.q: The percentile to compute. This can be a single number (e.g.,90) or a sequence of numbers (e.g.,[25, 50, 75]).axis(optional): The axis along which the percentiles are computed. Useful for multi-dimensional arrays (like pandas DataFrames).method(optional): The method to use for interpolation when the desired percentile is between two data points. The default is'linear', which is what most people need.
Example: Basic Usage
Let's find the 90th percentile of a list of exam scores.
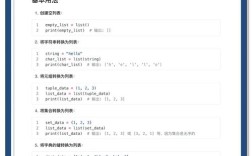
import numpy as np
# A list of exam scores
scores = [55, 62, 68, 72, 75, 78, 80, 82, 85, 90, 95, 100]
# Calculate the 90th percentile
p90 = np.percentile(scores, 90)
print(f"The list of scores: {scores}")
print(f"The 90th percentile is: {p90}")
Output:

The list of scores: [55, 62, 68, 72, 75, 78, 80, 82, 85, 90, 95, 100]
The 90th percentile is: 94.5
Explanation: The 90th percentile is a value such that 90% of the data is below it. To find this, NumPy sorts the data and then calculates the position. For 12 data points, the 90th percentile falls between the 10th and 11th values (90 and 95). By default, it uses linear interpolation, resulting in (90 + 95) / 2 = 94.5.
Example: Multiple Percentiles at Once
You can easily calculate several percentiles in one go by passing a list for the q parameter.
import numpy as np
scores = [55, 62, 68, 72, 75, 78, 80, 82, 85, 90, 95, 100]
# Calculate the 25th, 50th (median), and 75th percentiles
quartiles = np.percentile(scores, [25, 50, 75])
print(f"Quartiles (25th, 50th, 75th): {quartiles}")
Output:
Quartiles (25th, 50th, 75th): [72.75 78.5 88.25]- 25th Percentile (Q1): 72.75
- 50th Percentile (Median): 78.5
- 75th Percentile (Q3): 88.25
Method 2: Using the statistics Module
This module is part of Python's standard library, so no installation is needed. It's simpler but less feature-rich than NumPy.
Syntax
statistics.quantiles(data, *, n=4, method='exclusive')
The quantiles function is the most direct way to get percentiles. It returns a list of n-1 cut points that divide the data into n equal-sized groups.
data: The list of numbers.n: The number of equal-sized groups to create. To get percentiles, you'd usen=100for the 99 cut points (1st to 99th percentile).method:'inclusive'or'exclusive'.'inclusive'includes the min and max in the calculations, which is generally more intuitive.
Example: Basic Usage
To get a specific percentile, you can call quantiles and then pick the value you need.
import statistics
scores = [55, 62, 68, 72, 75, 78, 80, 82, 85, 90, 95, 100]
# To get the 90th percentile, we need the 90th cut point (n=100)
# The result is a list of 99 values.
all_percentiles = statistics.quantiles(scores, n=100, method='inclusive')
# The 90th percentile is the 90th element in the list (index 89)
p90_stats = all_percentiles[89]
print(f"The 90th percentile using statistics.quantiles is: {p90_stats}")
Output:
The 90th percentile using statistics.quantiles is: 94.5Note: The statistics module does not have a direct percentile() function like NumPy. You have to use quantiles and handle the indexing yourself, which can be less convenient.
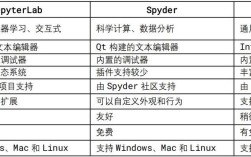
Comparison: NumPy vs. statistics
| Feature | NumPy (np.percentile) |
statistics (quantiles) |
|---|---|---|
| Ease of Use | Excellent. Direct percentile() function. |
Good, but less direct. Requires using quantiles and indexing. |
| Performance | Very fast. Optimized for large arrays. | Slower for large datasets. |
| Flexibility | Excellent. Handles multi-dimensional arrays, different interpolation methods. | Basic. Primarily for 1D lists. |
| Dependencies | Requires numpy installation. |
Built-in to Python (no installation needed). |
| Best For | Data analysis, machine learning, large datasets, scientific computing. | Simple, quick calculations on small lists without external libraries. |
Summary and Recommendation
For any serious data analysis, use NumPy. It's the industry standard, more powerful, and more efficient.
- Start with
numpy.percentile()for all your percentile needs. - Use the
statisticsmodule only if you are in an environment where you cannot install external packages and your dataset is very small.